What is the system tryping to predict?
Predpol predicts the risk of particular types of crime occurring within the next few hours in a given location. It seeks to predict the following crime types:
- burglary
- auto theft
- theft
- robbery
- assault
- battery
- drug crime
What data are the system’s predictions based on?
PredPol uses three historical data points to make its predictions:
- past type of crime
- place of crime
- time of crime
Newer events are weighted heavier than older events.
What approach does the system use to make its predictions? How is the data analyzed?
The PredPol tool was developed over the course of six years by a team of academics at UCLA and Santa Clara University in collaboration with the Los Angeles and Santa Cruz Police Departments. PredPol analyzes short and long-term patterns in crime reports, using machine learning and an “aftershock” algorithm—originally a mathematical model for predicting earthquake aftershocks.
A 2013 RAND study neatly describes the process:
- Lay a grid over the jurisdiction, as in traditional grid mapping.
- Estimate the current rate (called the “background rate”) at which new crimes appear in each grid square. This rate depends only on the characteristics of each grid square and jurisdiction-wide temporal effects. (For example, we can allow the current rate to increase in the summer months, when crimes are more frequent.)
- When there has just been a crime, assume that the rate for new crimes will jump up temporarily. (This can be thought of as the “aftershock rate.”) This jump declines the longer the grid square goes without seeing a new crime, eventually falling back to the background rate.
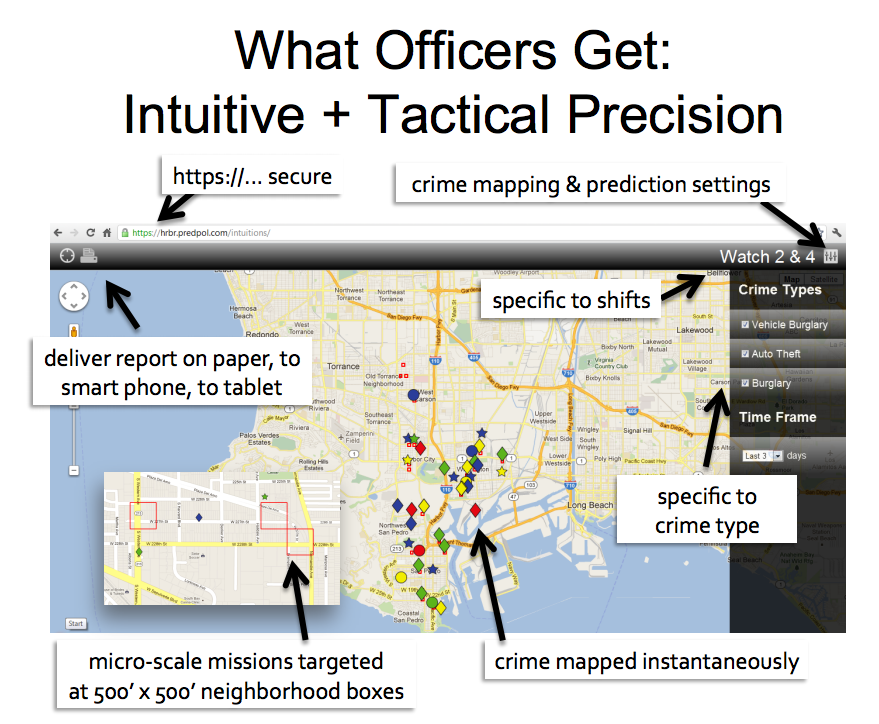
What do users of the system see or do?
PredPol’s output is a map with 500’ x 500’ boxes highlighting areas of possible crime hotspots. The forecast “consists of the top 20 boxes in rank order displayed on a map and available for directed police patrol.”
It looks like this:

How accurate are the predictions? How is accuracy defined and measured?
We’re not aware of any independent analyses of PredPol’s efficacy. In 2015, a study co-authored by company executives found that their “model successfully predicted 4.7% of crimes … a predictive accuracy 2.2 times greater” than existing techniques.
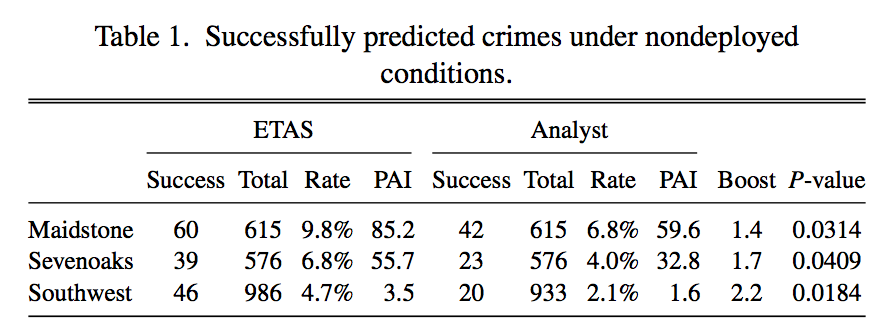
For the purposes of the paper, the authors defined predictive accuracy as “a crime occurring strictly inside an active prediction box” for a subset of crimes — the most common were burglary, car theft, and theft from vehicle. However, it’s unclear if PredPol internally uses this definition and measurement of accuracy.
Despite it’s limitations to a specific subset of crime, and despite the fact that the biggest “boost” went from a 2.1% success rate to a 4.7% success rate, the study has PredPol to claim that it leads to predictions “twice as accurate as those made through existing best practices,” and that “crime analysts using PredPol were 100% more effective – predicting twice as many crimes – as analysts using only hot spot mapping and intelligence models.”
Which departments are using the system?
According to a Forbes report from 2015, PredPol was then “used in almost 60 departments.” Here are some example departments:
- Los Angeles, CA PD
- Modesto, CA PD
- Santa Cruz, CA PD
- Atlanta, GA PD
- Tacoma, WA PD
- Reading, PA pd
- Fresno, CA PD
- Norcross, GA PD
How do departments use the system?
Tk.