What is the system tryping to predict?
HunchLab is a product of Philadelphia-based startup Azavea. It aims to predict how likely a particular crime type is to occur at various locations across a time period.
What data are the system’s predictions based on?
There’s a difference between input data HunchLab requires and what data they can add into their modes.
Per HunchLab:
Our belief is that the use of non-crime data sets as variables within a crime prediction system is important, because variables based solely upon crime data become skewed as predictions are used operationally.
Data that HunchLab requires from police departments:
- Boundaries for jurisdictions/divisions/districts, etc.
- Event data (crimes, calls for service).
- Unique ID for event, classification for events, longitude/latitude, street address, etc.
Data that Hunchlab can also incorporate fall into two major categories:
- Geographic data containing points, lines, and polygons. For example, the location of bars, restaurants, hospitals, bus stops, metro stops, etc. (This information can come from the police if they have their own geographic info at hand; if not, automatically can pull from OpenStreetMap.)
- Can also include U.S. Census data regarding vacancies to infer that a surrounding area might be blighted.
- Can also include U.S.G.S. natural terrain data regarding the elevation, pitch, and other geographic variations of an area. Per Hunchlab, lower altitudes near a body of water might indicate affluent areas or more impoverished areas depending on where you are.
- Temporal data sets, like weather data, social events, or school schedules.
HunchLab determines what data is most useful for prediction of each crime. In some cases, geography — the locations of prior crimes or particular landmarks — is the most important factor. In others, time — day of week, month of year — takes precedence.
What approach does the system use to make its predictions? How is the data analyzed?
HunchLab has several white papers and webinars describing the processes they use to arrive at their predictions.
Compared to the other systems surveyed here, HunchLab provides the most detail. Given that, we'll go into more detail as to how HunchLab works than other systems — simply because there is more public information.
HunchLab uses machine learning to make predictions. This means that HunchLab teaches a computer to determine how likely a particular crime type (assault, motor vehicle burglary, etc.) is to occur at various locations at a specific time period. To do this, HunchLab generates a training set from past data provided by a police department, usually crime reports + calls for service. (For more on this, see ‘Data that HunchLab requires.’)
According to HunchLab:
[W]e want to teach the computer to determine how likely a particular crime type is to occur at various locations for a given time period. We start this process in HunchLab by forming a set of training examples using the past several years of crime data. Each training example contains the theoretically derived variables we explained above, as well as the outcome (how many crime events occurred). For an entire municipality this training set will often include many millions of example observations. We can then start building the model.
What does this data look like? It’s data across space and time. Take Lincoln, Nebraska as an example. It’s 90 square miles. Hunchlab parses everything into 500 ft. cells which creates 12,000 cells. Taking three years of historic data, at 1-hour resolution windows, leads to 26,000 hour blocks to observe. 26,000 x 12,000 = 312,000,000 hour block cells to examine.
HunchLab works to build models based off this data. Before beginning to build models based off the past data, Hunchlab will hold back the most recent 28 days of data for later validation.
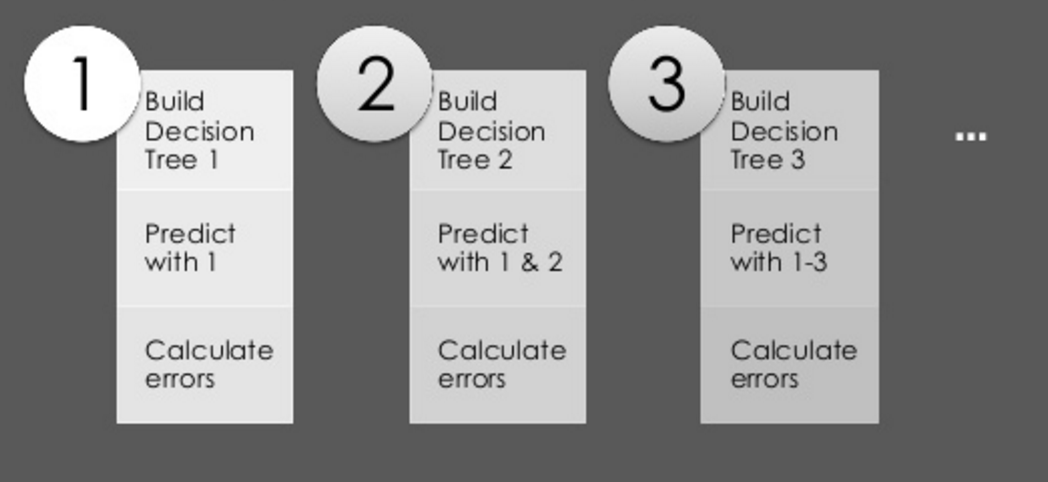
How does HunchLab build a model? Through a stochastic gradient boosting machine (GBM), which is comprised of decision trees. The idea behind GBM is this: each model will make some mistakes, but Hunchlab is trying to improve upon the past mistakes in an iterative fashion to make the best possible model.
Essentially: HunchLab begins by taking a random selection of the training examples. They’ll then build a decision tree that will separate examples of where crimes did or did not occur based on the variables. (So, for example, the first “decision” within the tree might be interpreted as “if an event didn’t occur in this location within the last year, then it’s probable none will happen today.”) Within each specific data set, this process will continue to build a tree that describes why crimes occur where they do. Hunchlab will repeat this process again, but will select another random portion of the training set. However, instead of building a tree to separate examples of where crimes did or did not occur, this tree is built to predict the errors from applying the first tree model to this new dataset. This is the concept of ‘learning from your past mistakes’ in action.
HunchLab continues this iterative process — decision tree 100, 101, 102, etc. — hundreds of times. The resulting model actually represents tens of thousands of decision rules as to why crimes do or don’t occur.
HunchLab repeats this entire process several times. Each time they start anew, some of the initial example data is held back. The end result is a yes/no prediction for if a crime will occur, which is expressed as a probability.
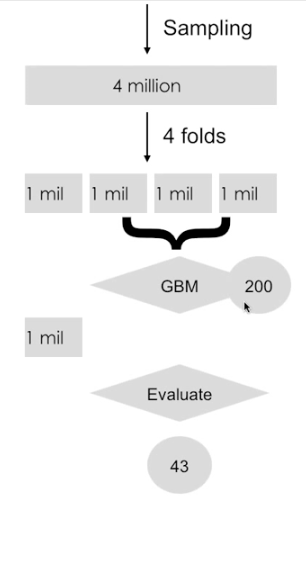
Hunchlab then cross-vaildates their model, which looks like this:
What’s happening here?
Basically, HunchLab wants to figure out how complex their model should be. If it’s too complex, the model might be very good at making predictions on the dataset it has access to. But, it might not make good predictions in reality.
So, following the above example, of 4 million sampled observations, each is split up into 4 folds, so each dataset has 1 million observations.
What HunchLab wants to see is how many iterations of decision trees within the model is ideal so they don’t overfit their model or make it too complex.
To do this, HunchLab uses the model they came up with to predict against the held out data — that saved one million observations. But, instead of just running the entire model against that held out data, they run it at every number of iterations within that model. So, for example: if a GBM model had 200 iterations total, Hunchlab would have the model predict against the held out data only using the first decision tree, the first two, 20 decision trees, and so on. They do this in order to determine how complex the final model should be to most accurately represent the data they are modeling. It could be that the best average is 43 iterations.
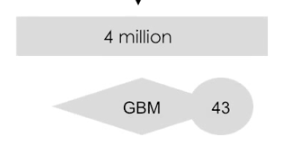
HunchLab then builds a final GBM model on all of the data for that many iterations. So, in the above example, HunchLab would take all 4 million of the sampled down observations and build exactly 43 iterations within the GBM model.
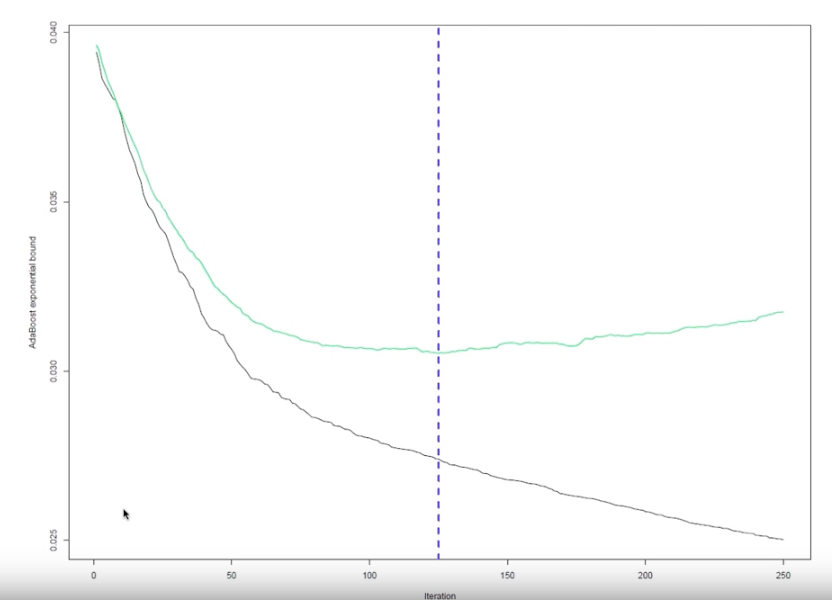
In the graph above, there are 250 iterations. The black line represents how good the model is doing against the 3 million observations. Eventually, the further you go out (the more iterations you have) you can get to the point where you perfectly model the data. But, that’s not necessarily great in reality, which is shown by the green line. The green line represents how well the model performs at each iterations against the held out data. That’s closer to 125 iterations, not 250.
From here, once HunchLab determines their model is at the right level of complexity, they want to translate the predictions of the model (whether one or more crimes will occur or not, which is expressed in probability) into expected counts.
To do so, they run what’s called a Generalized Additive Model (GAM). The GAM does two things. First, it translates what were probabilities into "counts."" Second, it also calibrates count levels with other key variables, like days of the week, time of the day, how many events in the past have happened at this location, how many days in-between events, etc.
For example, take a model that slightly over-predicts crimes on a Thursday. The GAM calibration would slightly lower the predictions for Thursdays to center the predictions on the training data.
Before this model building process began, HunchLab held back the most recent 28 days of data. This 28 days of data is used to score (evaluate) each model variation. What Hunchlab is doing here is evaluating the accuracy of the model to predict what occurred within that 28 days of data.
HunchLab not only compares the accuracy of one model against another created by their system, but also compares one of their models against six baseline models (“If we can’t beat one of these baselines, something is going wrong — maybe the data isn’t clean, or something. [We want to know we can] Improve over what you’re likely doing today. Baselines are designed to mimic what an analyst might do.”]
HunchLab then takes the model that had the best score (most accurate in making predictions in the last 28 days of data) and rebuilds that model on all of the data, including the last 28 days of data. At that point, that model is ready to be used by the police department.
Importantly HunchLab and the police department jointly determine a severity weight for the crime models. For example, HunchLab and the department develop a quantitative answer to the question “how important is it to prevent this type of crime?” Another consideration in building the model is: patrol efficacy. For example: What proportion of these crime events are preventable via patrol cars?
What do users of the system see or do?
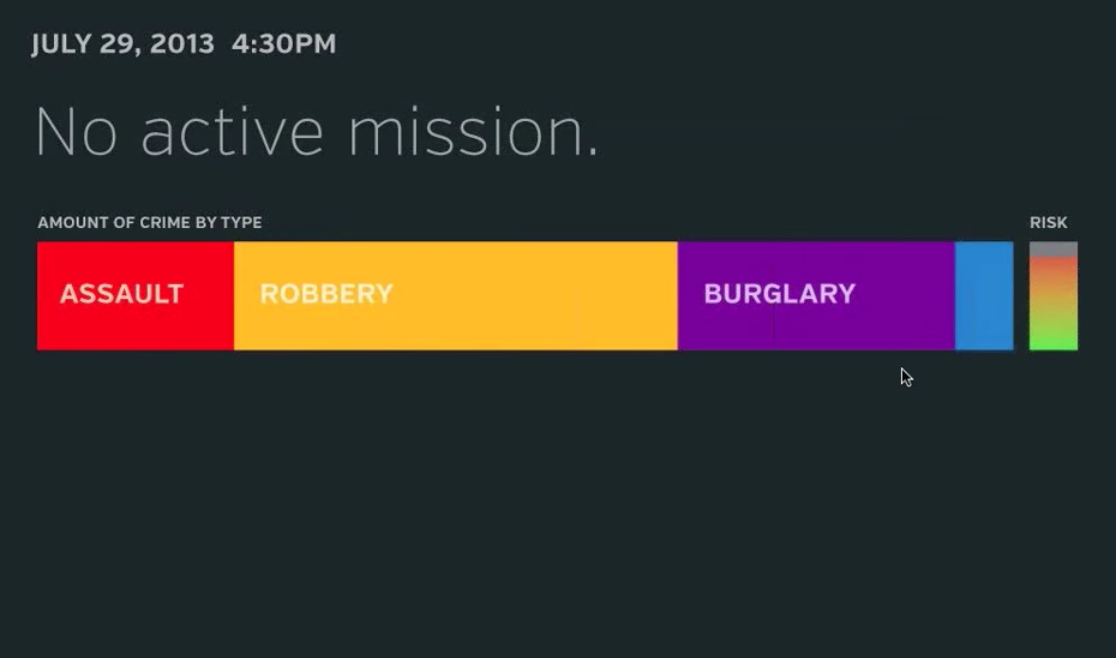
Predictions are count expectations for each specific ‘cell’ on a map, say the 500’x500’ cell, for a specific period of time.
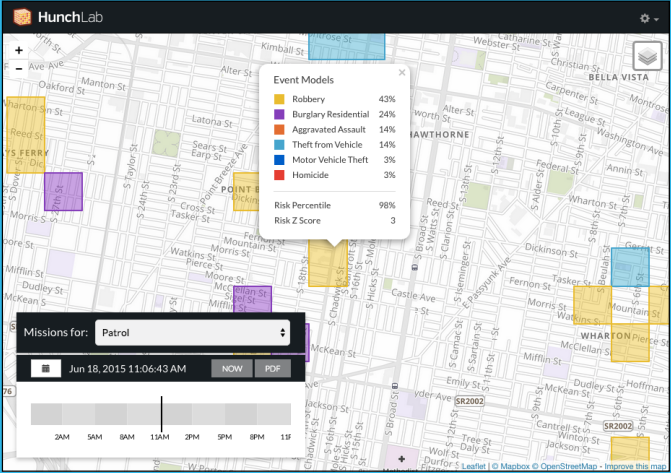
Another HunchLab product, Sidekick can display the same information to officers based on their specific locations. So, as an officer moves through time and space, the predicted crime risk an area may vary. That looks like this:

How accurate are the predictions? How is accuracy defined and measured?
In our survey, we have not found any specific study (internal or external) regarding the accuracy of HunchLab.
We also did not see any release or statement from a police department claiming that since the introduction of HunchLab a crime has been reduced by X%. Nevertheless, “studies of HunchLab’s effectiveness are underway in several cities, and researchers in Philadelphia are comparing patrolling in marked police cars to sending unmarked cars, which could quickly respond to crime, but might not deter it.” If and/or when those studies are made available, they’ll be discussed here.
Which departments are using the system?
- St. Louis County PD
- Peoria, AZ PD
- Philadelphia PD
- Lincoln, NE PD
- New Castle County, Delaware PD
Previous versions of HunchLab have been used by:
- City of Tacoma PD
- Pierce County, WA PD
- Northwest Ohio regional Information System (NORIS)
HunchLab has been piloted by:
- NYPD
How do departments use the system?
We're not positive as to how departments use HunchLab.
Nevertheless, one of HunchLab's partner products is Tacticts. It offers officers in the field one of several potential tactics to pursue, given the likelihood of a certain crime, in a certain area, at a certain time.

Eventually, a goal of HunchLab's is to measure which tactical intervention leads to the best outcome.